Vineyard Health after the 2017 California Wildfires
This post is adapted from a poster submitted for an undergraduate remote sensing course.
Background
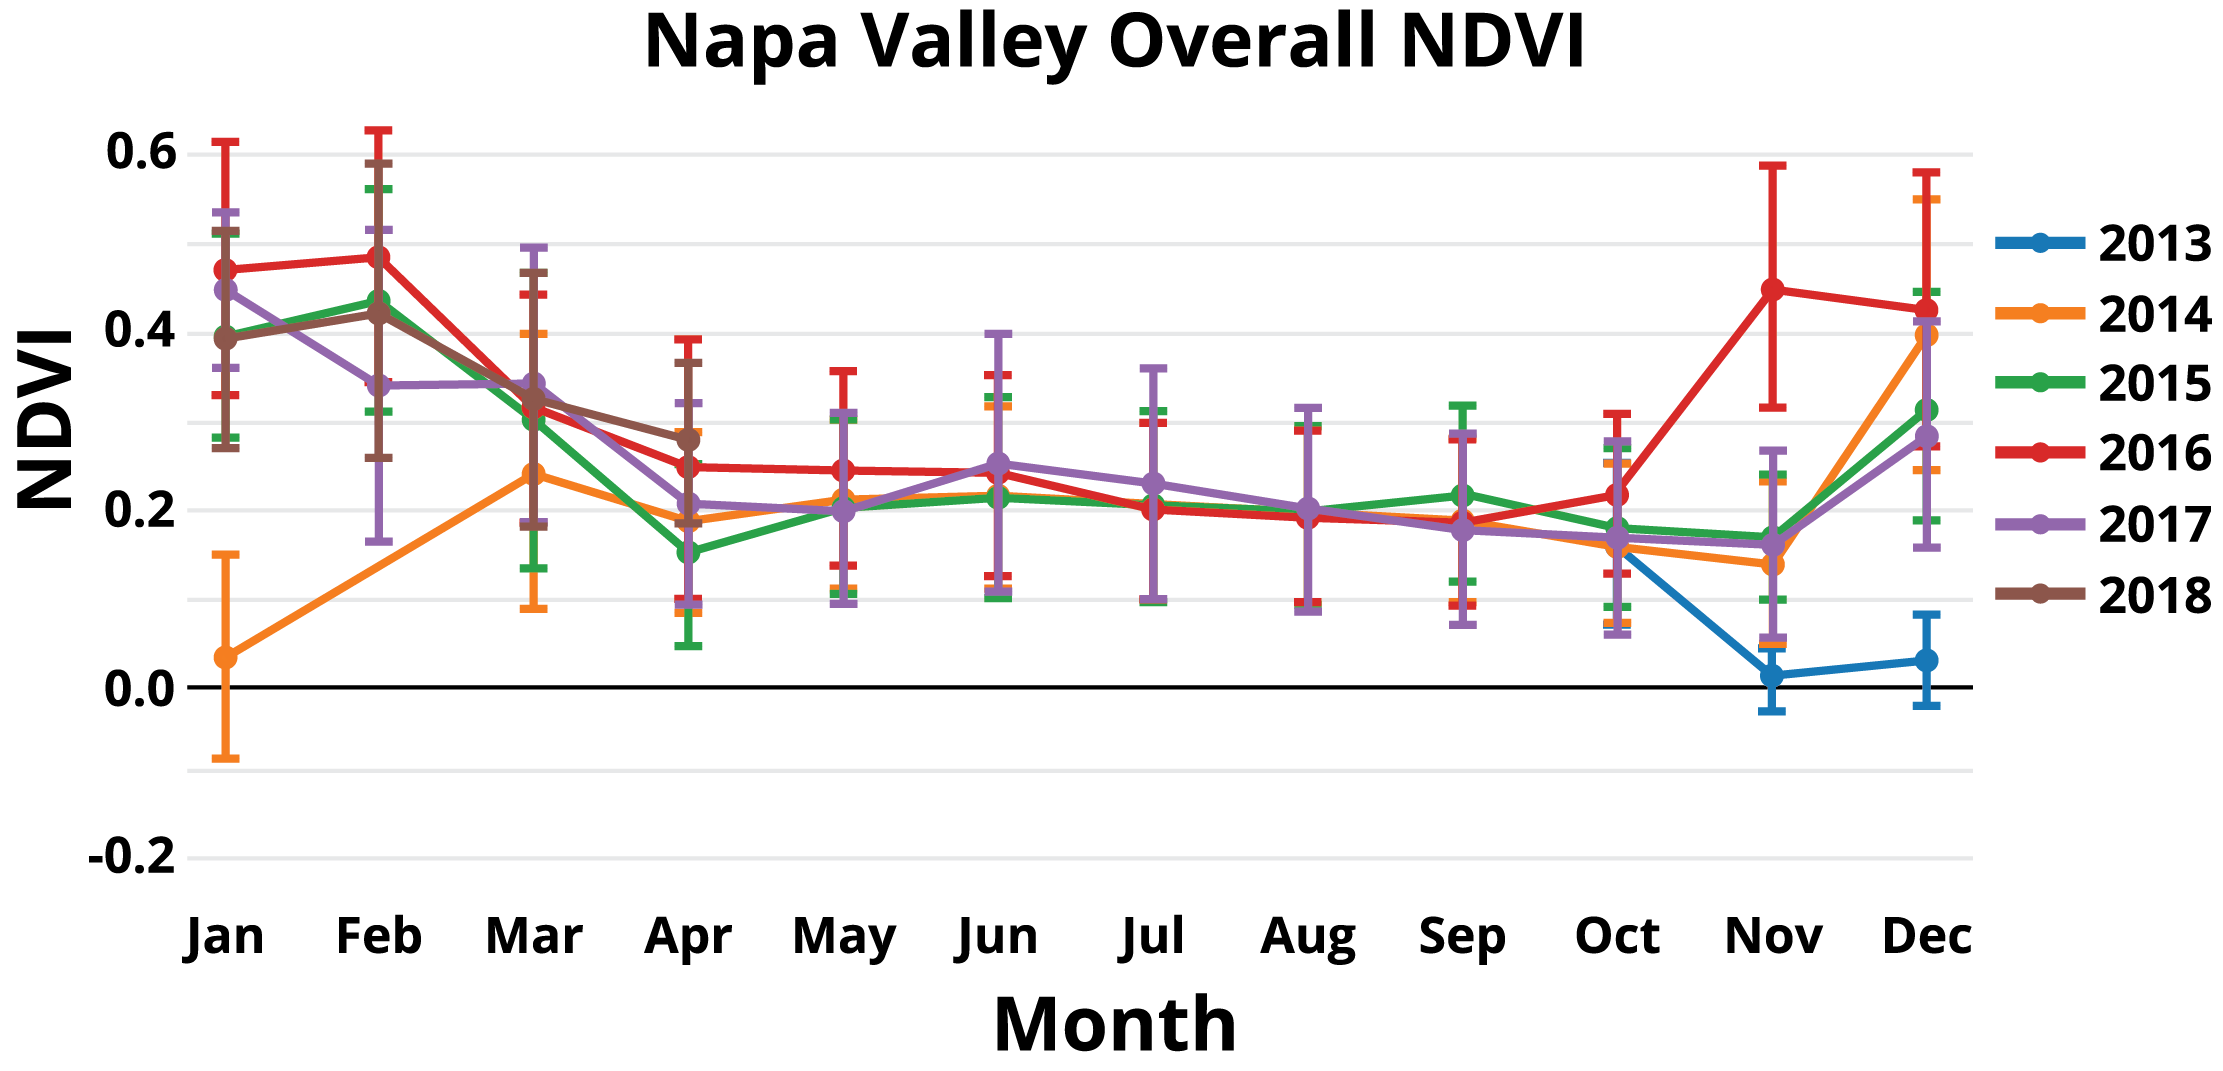
In 2017 wildfires in California burned around 1.2 million acres of land and destroyed more than 10,800 structures1. In October 2017 the Atlas and Nuns wildfires burned on both sides of Napa Valley and blanketed the vineyards within the valley in smoke. The Napa Valley region is known worldwide for the wine it produces and contributes more than $50 billion anually to the US economy2. In my analysis, I attempt to determine if the smoke covering the region had a significant impact on the health of vineyards in the region with qualitative and quantitative measures. In my qualitatitve measure, I will graph the average NDVI over the observed time period which should highlight any obvious trends. For my quantitative measure, I will test if there is a statistically significant difference between the most recent measurements (April 2018) and measurements in the same month of other observed years.
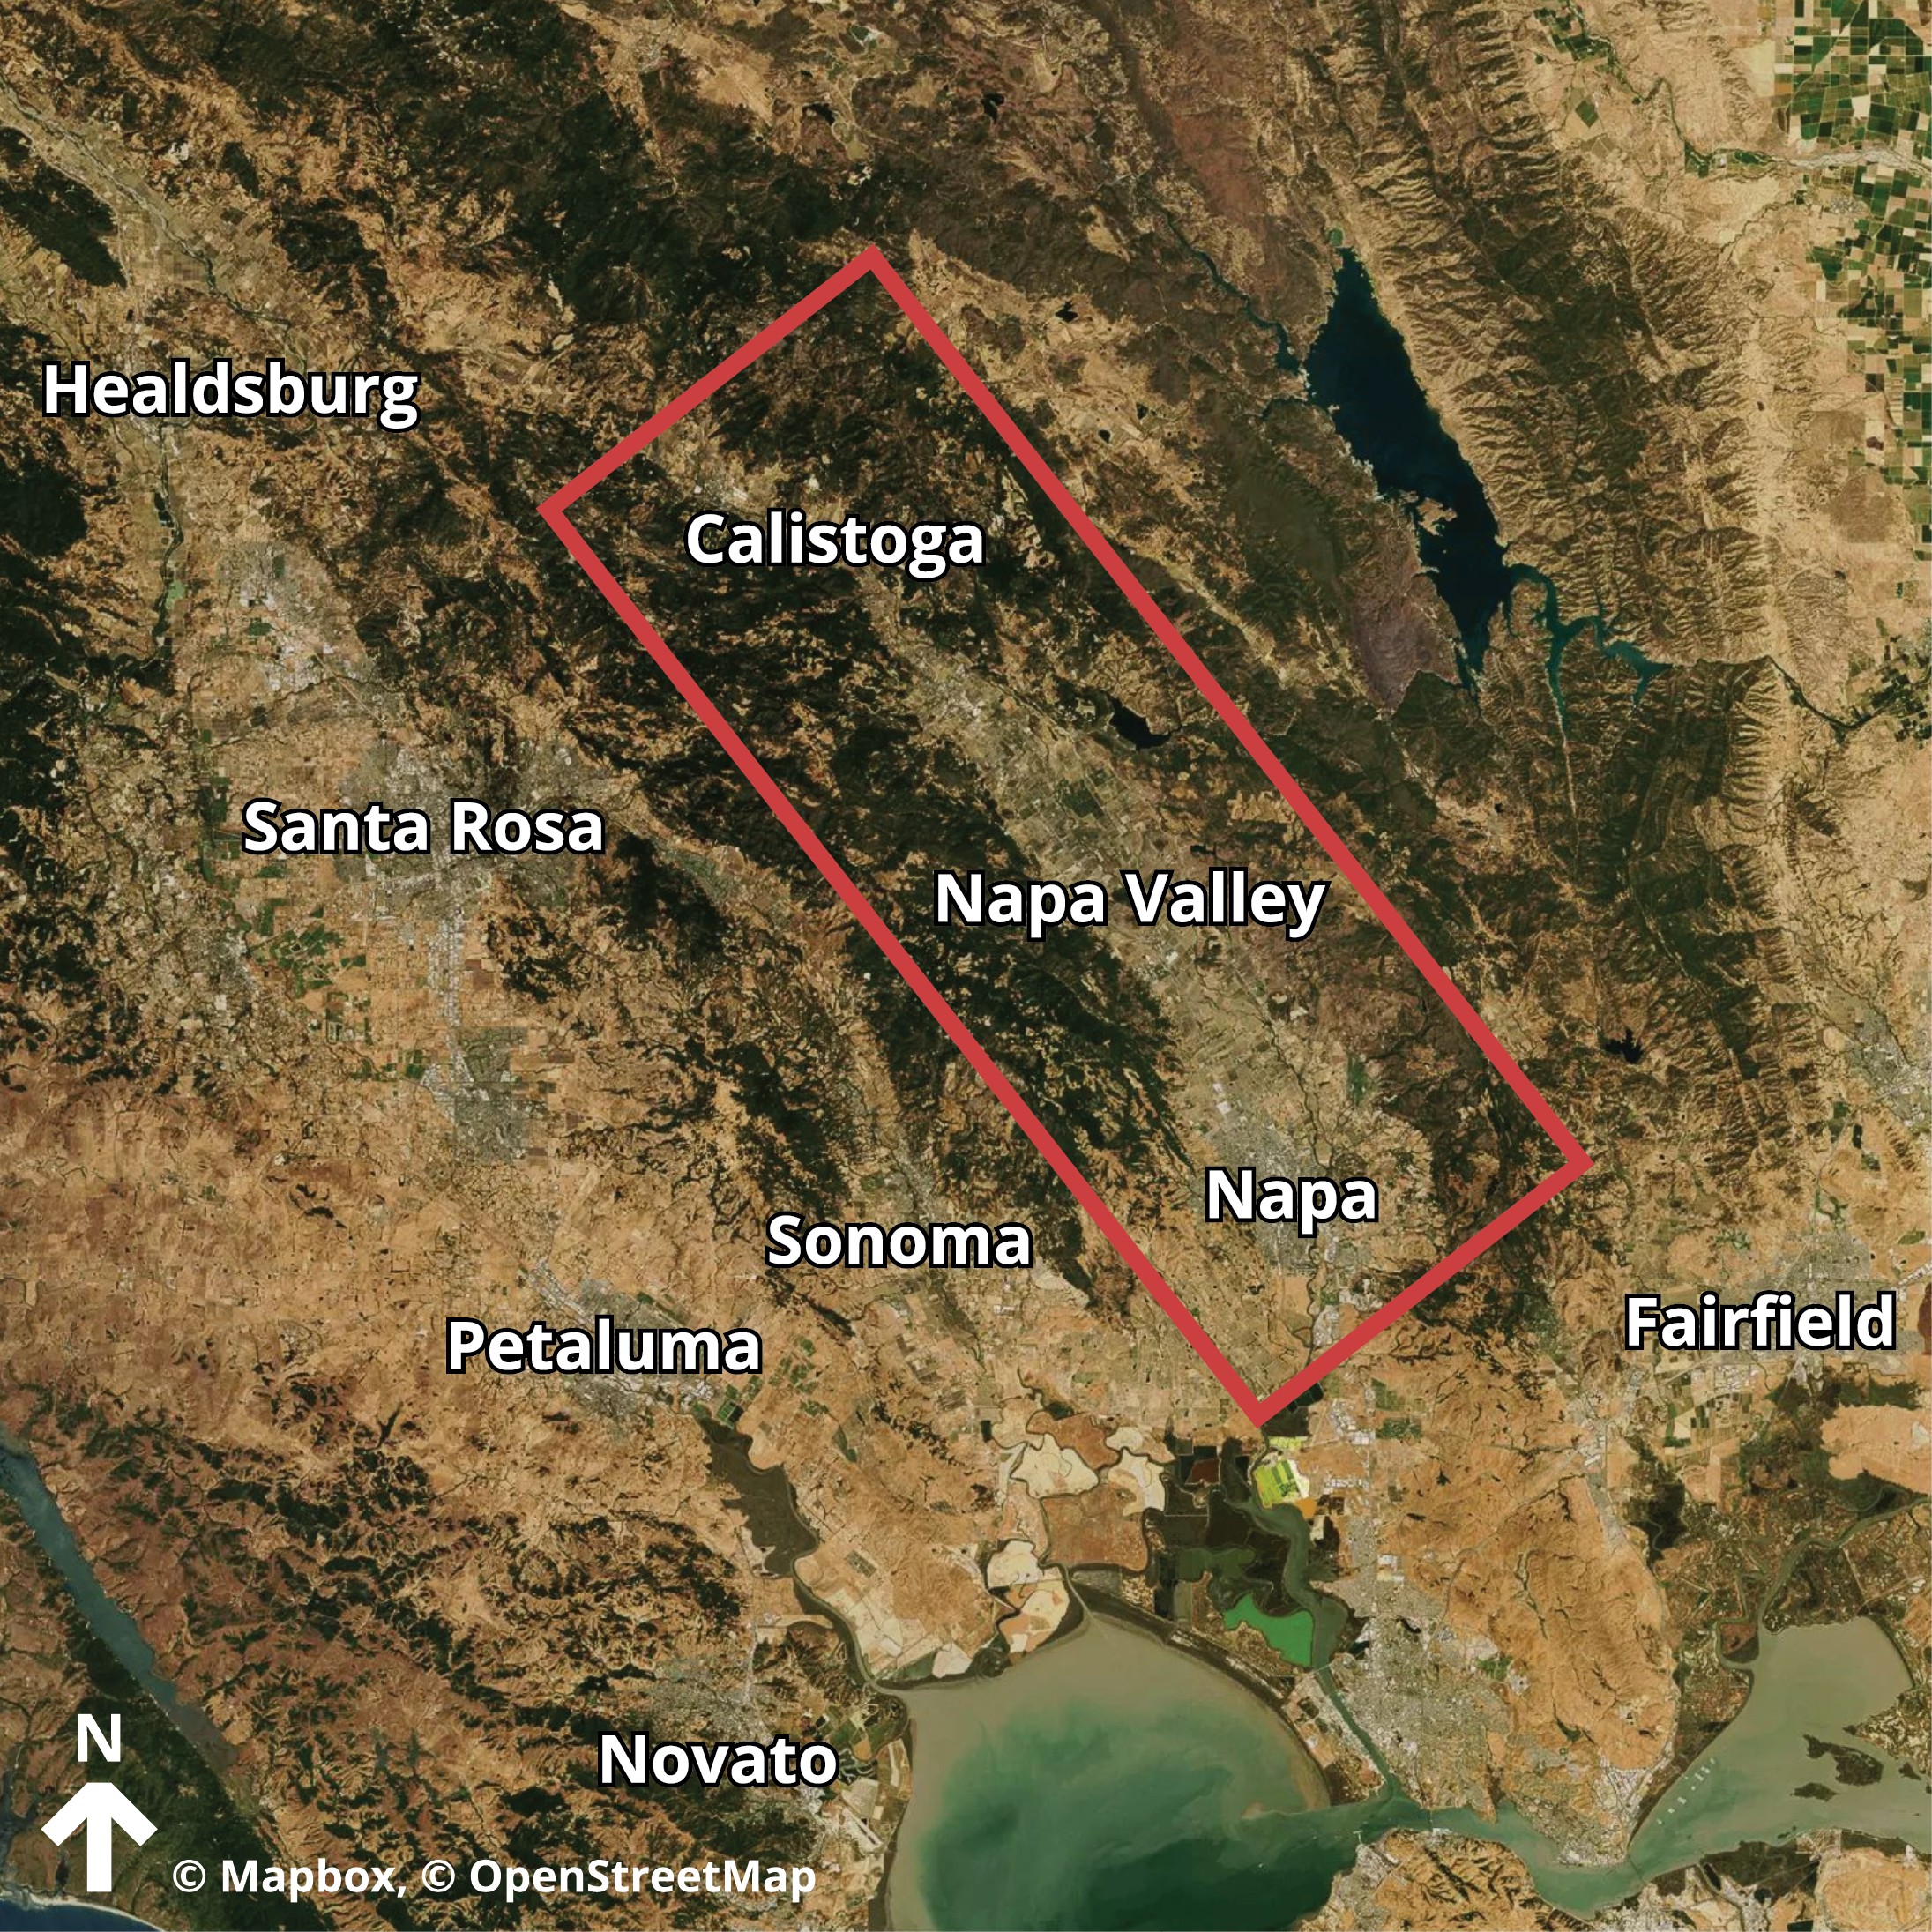
Study Area
I am termining if there is a significant effect within the Napa Valley American Viticultural Area (AVA). I selected eight sub-AVAs within the Napa Valley AVA to study and within those sub-AVAs I am observing ten randomly selected vineyards. The sub-AVAs I am studying are Calistoga, Los Carneros, Oak Knoll, Oakville, Rutherford, Saint Helena, Stags Leap, and Yountville.
Materials and Methods
 |
Search for ScenesI created a geojson file containing a polygon of the Napa Valley area. I searched the Planet API with this polygon as my geometry bounds and RapidEye OrthTiles as my product. I then stored the IDs of all scenes acquired between January 1st, 2013 and April 30th, 2018. |
 |
|
 |
Download Clipped ScenesFirst, I filtered all the searhed results to only contain scenes where the entire Napa Valley area is within the scene. Next, I created a Python script to automatically request scenes clipped to each of the vineyards I am observing and download them to a directory. |
|
|
 |
Filter out Cloudy ScenesFor each vineyard, I create a reference scene by calculating the average brightness of each pixel of all the scenes I have downloaded for every band. I then compare every downloaded scene to this refernce scene and discard any scenes where more than five percent of pixels are outside of two standard deviations of their corresponding reference pixel. |
|
|
 |
Calculate Average NDVII created a Python script to calculate the average NDVI of all pixels in a scene for every scene I have downloaded. I then output the results to a CSV file. |
|
|
 |
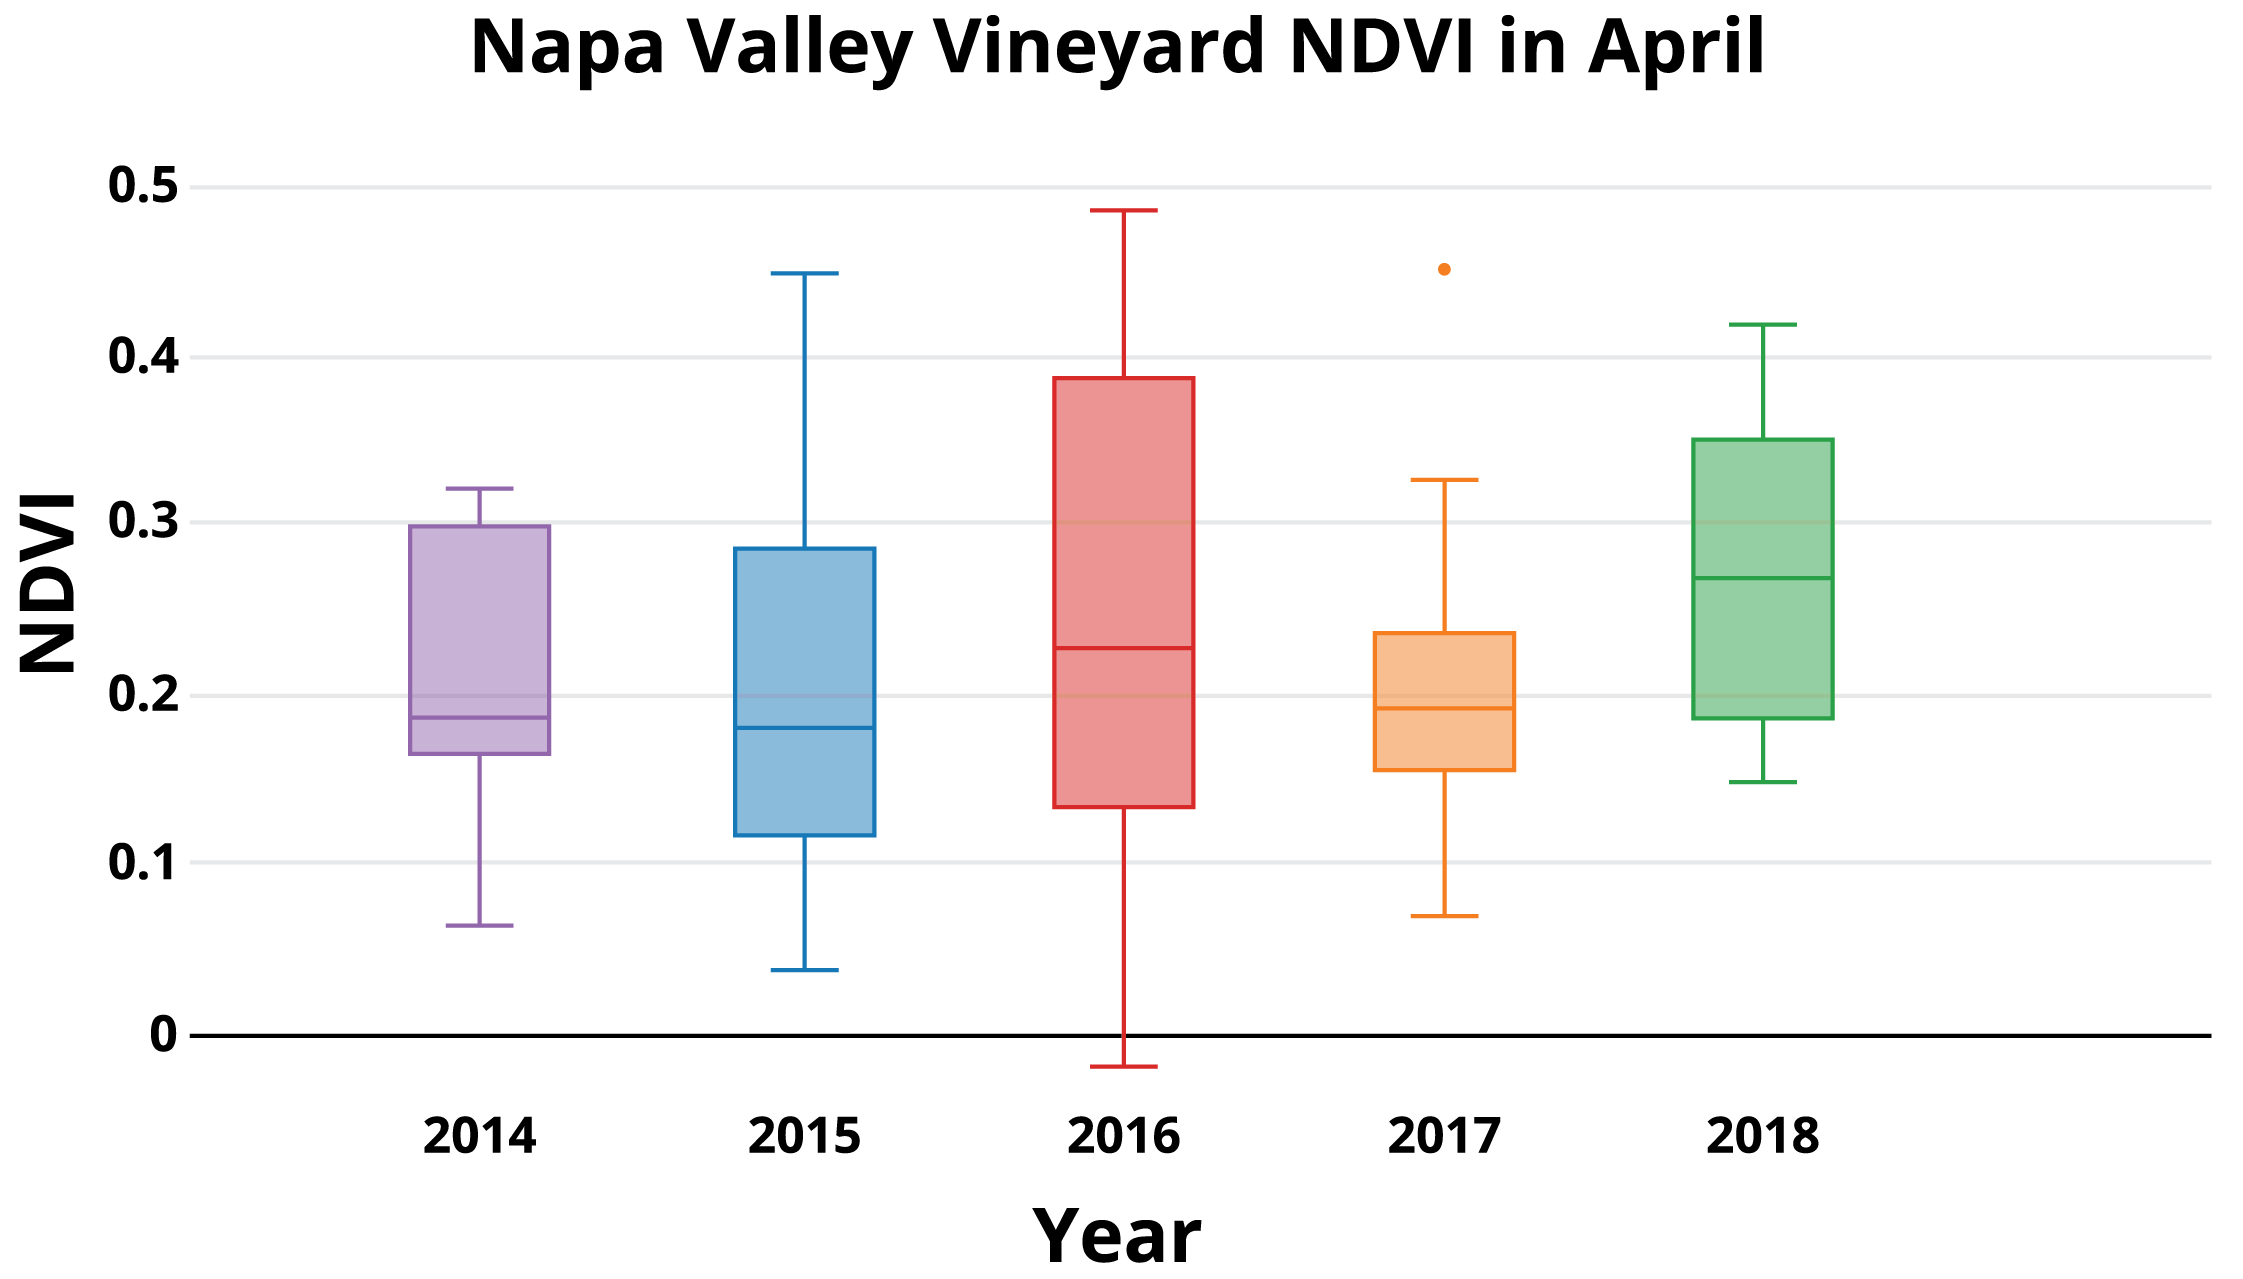
Analyze ResultsUtilizing another Python script I wrote, I find which vineyards I have observations for in April of all years in my time range of 2013 to 2018. For each year I then put every observed NDVI value in its corresponding group. I then calculated if there was a significant difference between groups using a one-way balanced ANOVA test. |
Results
With p < 0.05, 4 degrees of freedom in the numerator, and 45 degrees of freedom in the denominator I calculated the f-ratio to be 0.646 and the critical value to be 2.09. The f-ratio does not exceed the critical value so we fail to reject the null hypothesis.
Conclusions
The analysis shows that there is not a significant difference of the health of vineyards in the region after the 2017 California wildfire season. When analyzing the results there does appear to be abnormal dips and peaks in NDVI between November 2013 and March 2014 and in November of 2016. The cause of these anomalies is unknown and warrants further examination.